Wunderlich-Malec developed a City-Scale Net-Zero simulator to help cities and campuses develop and test strategies that achieve Net-Zero faster. This article provides the results of applying various strategies to this simulator for a typical mid-size city. As more countries, states, cities, and businesses commit to Net-Zero emissions from energy use, analysis of results and costs for the various strategies are needed. The mGrid team at Wunderlich-Malec built a simulator to enable cities and organizations to perform analysis of Net-Zero strategies, plans, and costs and assist in the selection of the best strategies to achieve Net-Zero faster.
This case study is for a city with a 150,000 population and a 2020 peak demand and annual usage of 400 MW and 1,550,000 MWh, respectively. Currently, the city municipal electric utility emits 1.4 million metric tons per year or 1,991 lb./MWh. The simulation sets 2040 as the target for Net-Zero for the electricity system.
Surprising Net-Zero Simulator Outcomes for a Mid-Size City:
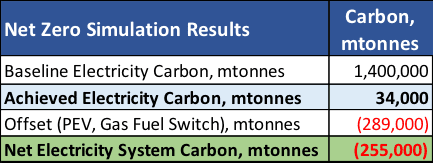
- Carbon: Net electric utility carbon is down from 1,400,000 to -255,000 metric tons int 2040. This includes -290,000 metric tons of offsets from plug-in vehicle (PEV) and natural gas fuel switching.
- Costs: $64/MWh down from $66/MWh, savings of $8,000,000 per year
- Renewable: Achieved 93% renewable content which could be accomplished by 2030
- Resiliency: Local power provides for 98% islanding capability
- Utility Annual Usage: About the same due to fuel switching adding 35% new load
- Local Solar PV: Reduced usage by 40%
- Cost Impact: No increase in power costs due to:
- $30 million reduction in capacity and transmission savings
- Lower cost of purchasing power in the real-time power markets hedged with local generation
Net-Zero Strategies Simulated:

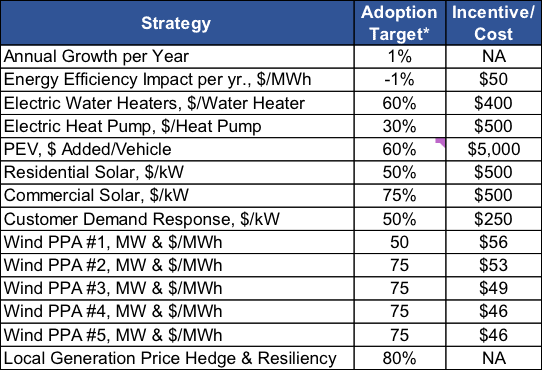
The simulator allows users to input the targeted adoption and incentive levels for a comprehensive set of net-zero strategies. The incentives, procurement, and investment costs are then factored into the overall power costs.
- Annual growth and energy efficiency
- Electric water heaters and heat pumps
- Plug-in electric and hybrid electric vehicles (personal & commercial)
- Residential and commercial solar PV
- Customer demand response
- Wind and solar power purchase agreements (PPA)
- Wholesale renewable real-time power hedged with substation generation
Results
Table 2 below summarizes the carbon emissions reductions achieved at a lower cost $64 vs. $66/MWh:

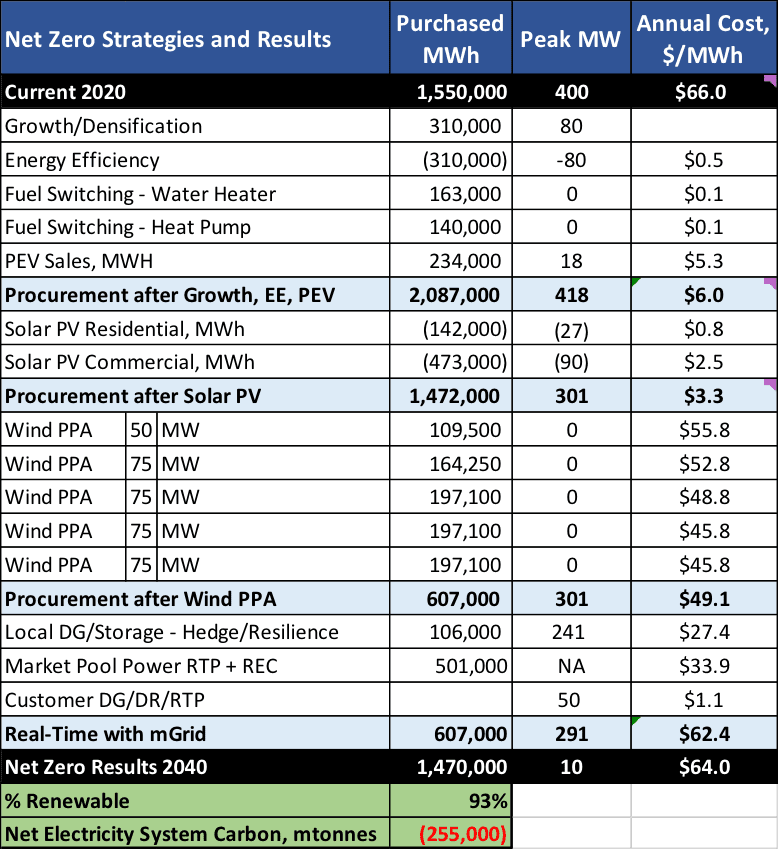
Table 3 summarize the simulation results for each strategy:

- Column 1 shows the strategies
- Column 2 shows the impact on total annual electricity usage and procurement in MWh. Total city annual usage decreases slightly to about 1,500,000 MWh. For this simulation, procurement or power supply is from three strategies:
- Execution of long-term renewable power purchase agreements serving 60% of the load
- Wholesale renewable power procurement serving 35% of the load
- Substation generation and customer demand response for 1) resiliency, 2) wholesale power hedging, and 3) avoiding capacity and transmission charges, 98% reduction or $30,000,000 of capacity and transmission savings
- Column 3 shows the impact of each strategy on peak electric demand in MW
- Column 4 shows the total cost of power for the electric utility before and after while breaking out the costs for each strategy in terms of incentives, purchased power, and financing for new substation or community generation.
If you are interested in analyzing Carbon Net-Zero strategies and their potential benefits for your organization, please contact John Kelly at john.kelly@wmeng.com or visit our Microgrid Solutions page.
